Abstract
Modern HPC facilities increasingly rely on GPU-accelerated clusters to drive both scientific computing and AI workloads. Performance variability is a critical issue in these systems, undermining efficiency and performance reproducibility. While prior studies have extensively analyzed variability in CPU-centric supercomputers, similar large-scale investigations on GPU clusters are lacking.
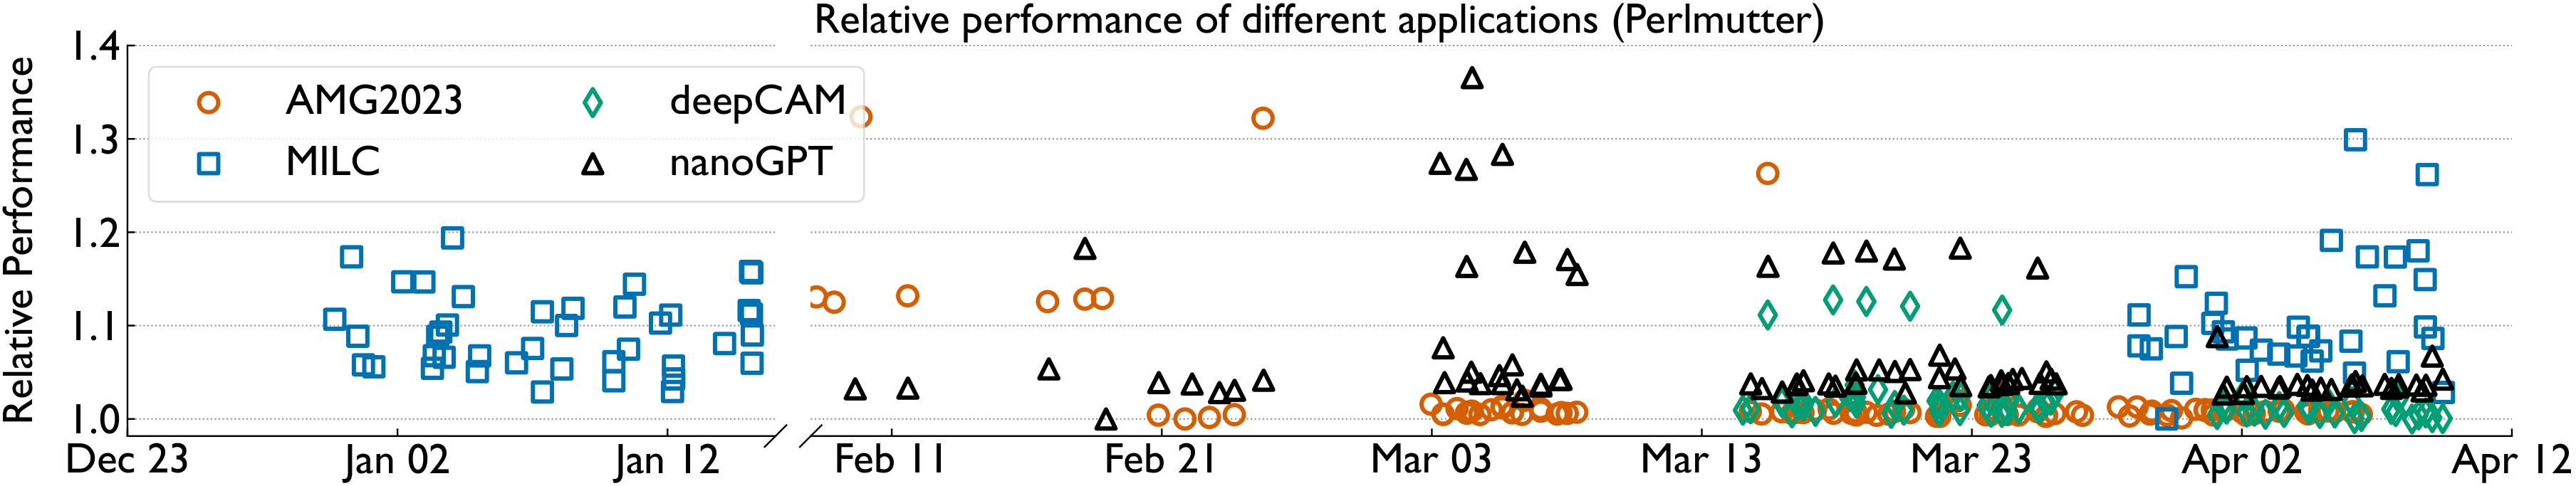
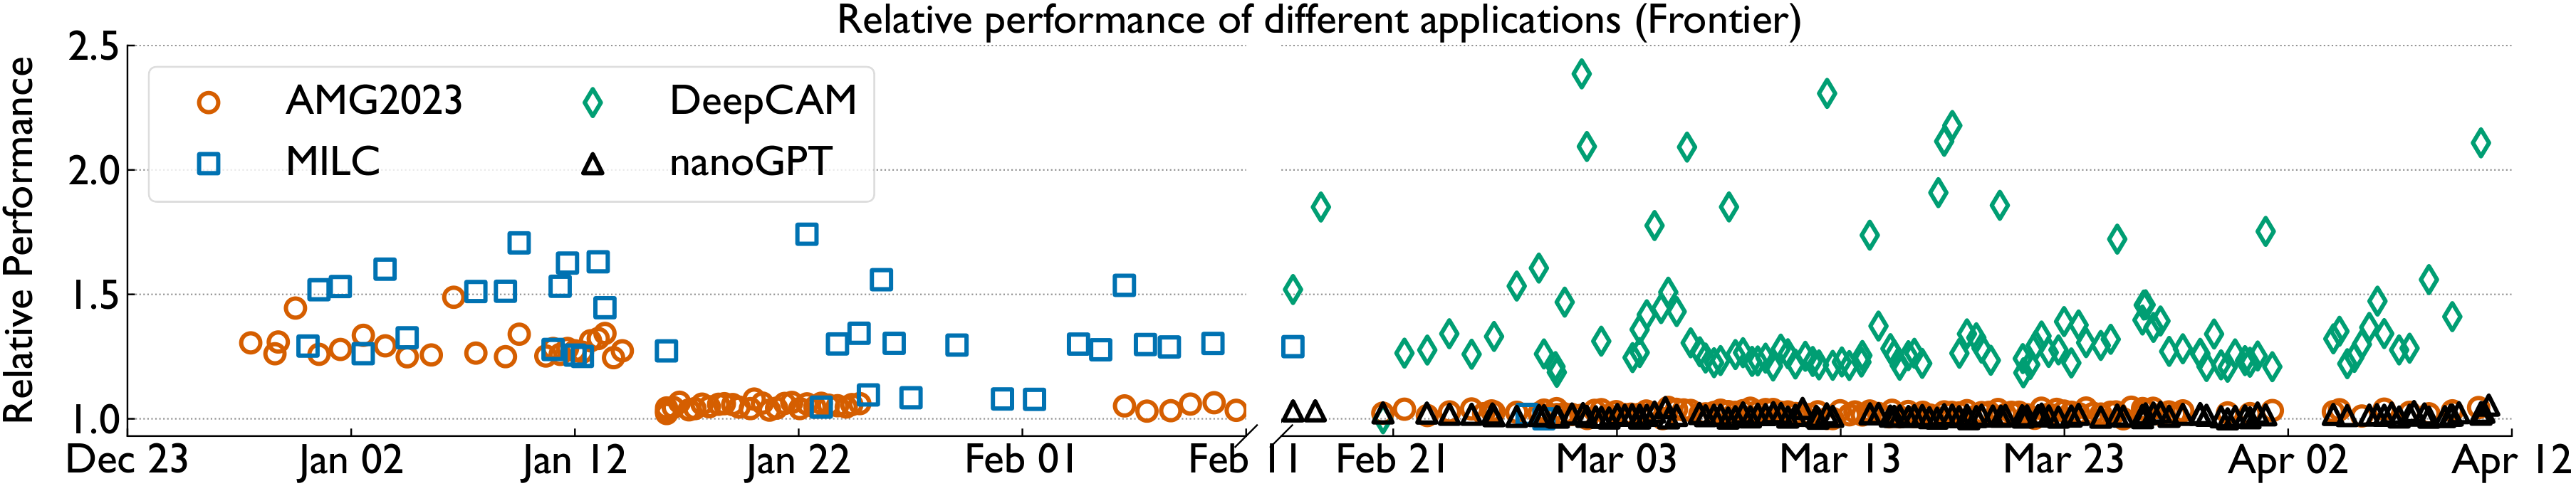
To address this gap, we set up a longitudinal experiment on two state-of-the-art GPU-based supercomputers: NERSC's Perlmutter and ORNL's Frontier. We benchmark several representative HPC and AI applications and collect detailed performance data including network counters, profiling output, and job scheduler logs. We analyze this data to identify the impact of compute performance variations, allocated node topology, and network conditions on the overall runtime variability. We also use a machine-learning-based approach to identify potential correlations between these factors, and to forecast performance variability — providing actionable insights for both system administrators and users.
Key Contributions
First longitudinal GPU study
A four-month study on two flagship GPU supercomputers, yielding a comprehensive dataset of performance measurements across diverse applications and system states — the first to quantify variability on GPU-accelerated HPC at this scale and duration.
Root-cause analysis
An in-depth analysis of hardware differences and the impacts of concurrent jobs, job placement, and network conditions — isolating compute variability from communication variability.
ML-based forecasting
XGBoost models that identify the critical metrics driving variability and predict run-to-run performance across both HPC and AI workloads, accurate even with only a handful of training samples.
Actionable insights
Concrete recommendations for system administrators and users to predict and mitigate performance variations in GPU-accelerated environments.
Systems & Applications
Both machines are HPE Cray EX systems built on a three-hop dragonfly topology with the HPE Slingshot-11 interconnect. We probe each system with four applications spanning traditional MPI-based HPC codes and modern NCCL/RCCL-based distributed AI training.
Perlmutter
- 1,792 GPU nodes
- 4× NVIDIA A100 per node (40 / 80 GB HBM2)
- 64-core AMD EPYC 7763 Milan CPU
- 4 Cassini NICs · 100 GB/s injection / node
- Slingshot-11, 3-hop dragonfly
Frontier
- 9,408 nodes · first exascale system
- 4× AMD MI250X (8 GCDs, 64 GB HBM2e each)
- 64-core AMD EPYC Trento CPU
- 4 Slingshot NICs · 100 GB/s / node
- Slingshot-11, 3-hop dragonfly
Application workloads & inputs (64 nodes)
| Application | Type | Machine | Key input parameters | Jobs |
|---|---|---|---|---|
| AMG2023 Algebraic multigrid | MPI / HPC | Perlmutter | -P 4 8 8 -n 128 64 64 -problem 1 | 104 |
| Frontier | -P 8 8 8 -n 128 64 64 -problem 1 | 168 | ||
| MILC Lattice QCD | MPI / HPC | Perlmutter | nx 40 ny 160 nz 320 nt 320 | 78 |
| Frontier | nx 80 ny 160 nz 320 nt 320 | 38 | ||
| DeepCAM Climate CNN | NCCL/RCCL / AI | Perlmutter | max_epochs 8, batch 2, dali-es-gpu | 67 |
| Frontier | max_epochs 4, batch 2, hdf5 | 109 | ||
| nanoGPT 20B GPT via AxoNN | NCCL/RCCL / AI | Perlmutter | gpt2, 20B, batch 8, block 512, ga 256 | 94 |
| Frontier | gpt2, 20B, batch 8, block 512, ga 512 | 103 |
For each run we capture application runtime, MPI (mpiP) or PyTorch profiles, low-level Cassini NIC counters, and Slurm job logs. Two micro-benchmarks — an FP16 GEMM and an Allreduce — run before each application to probe raw compute and communication performance.
Application & GPU Variability
Breaking down execution time reveals a consistent story: compute is stable, but collective communication — especially Allreduce — drives variability.
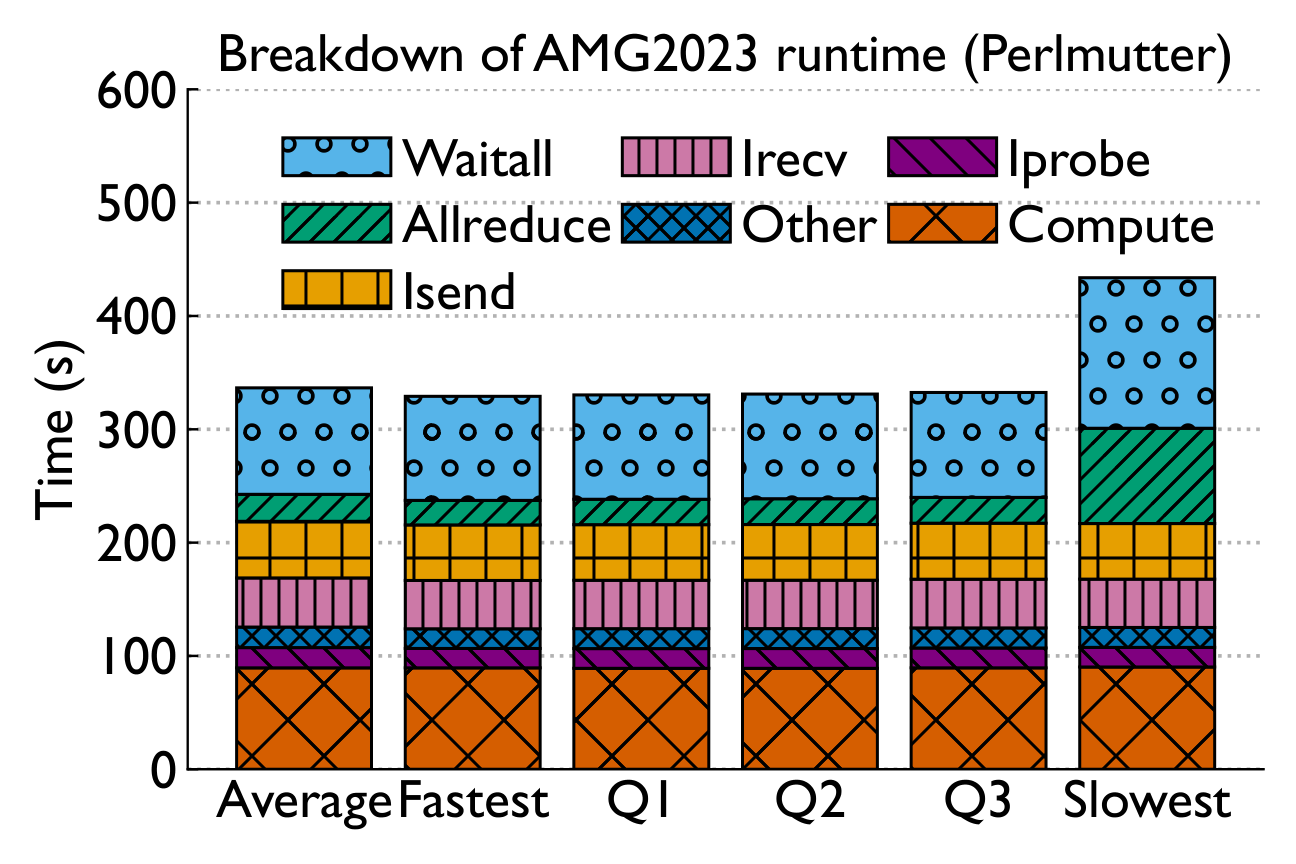
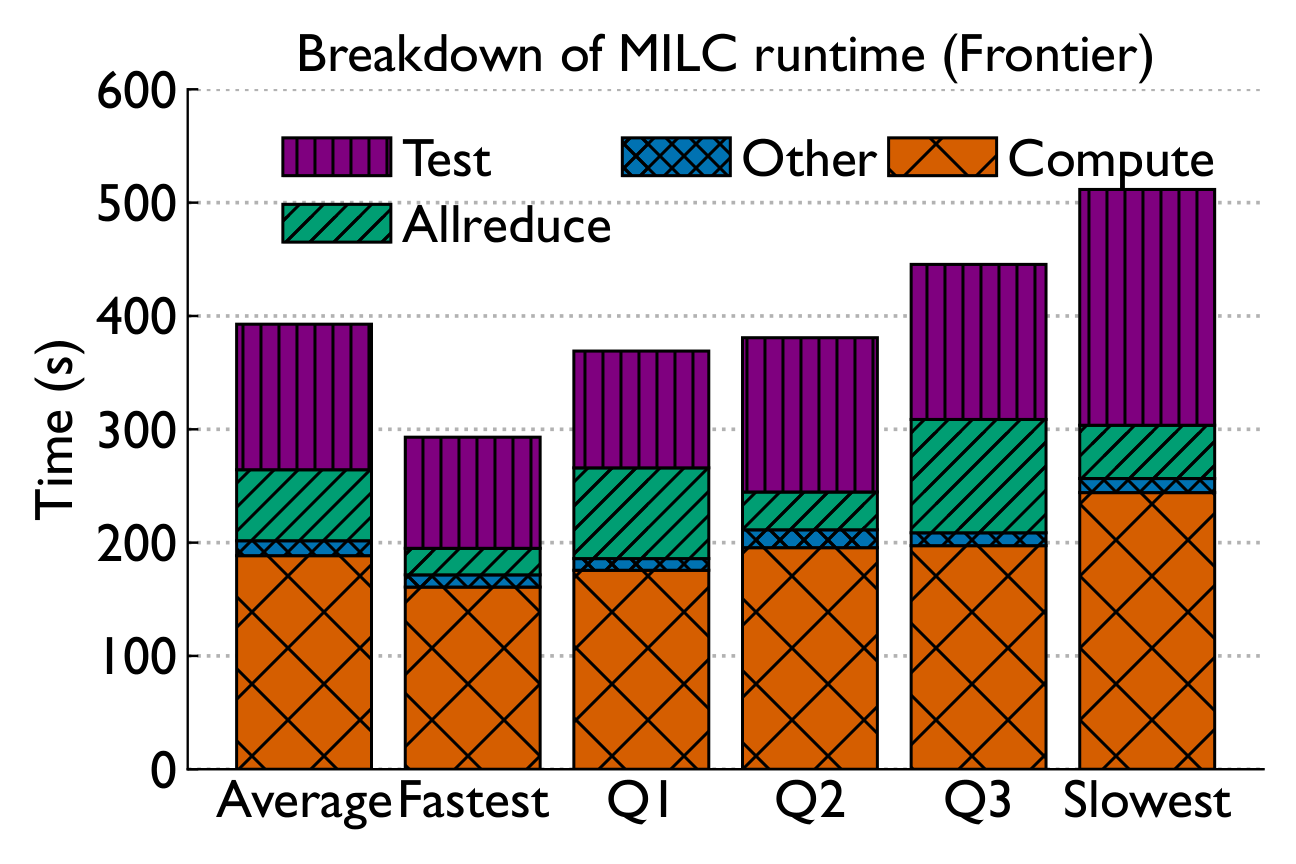
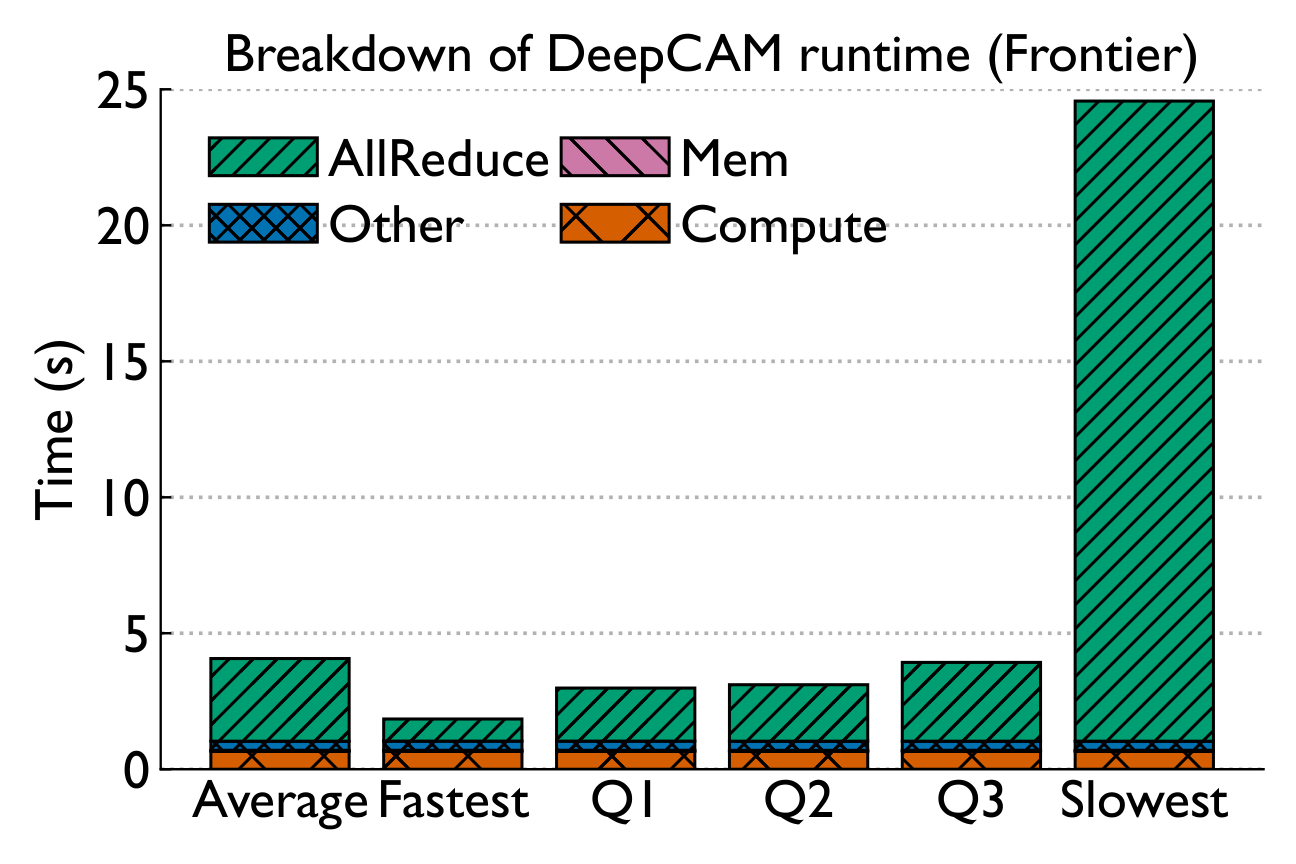
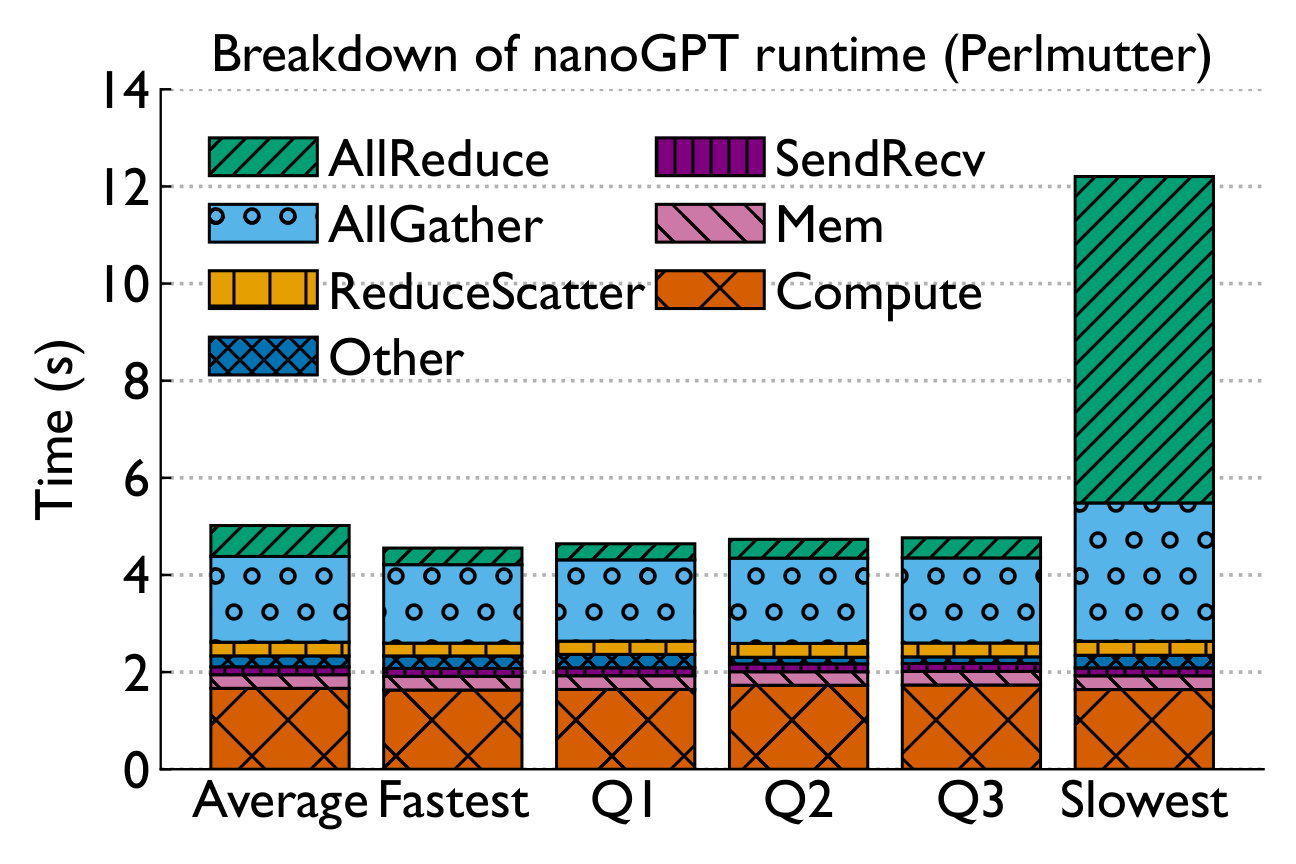
Performance variability arises primarily due to slowdowns in collective communication — in particular, Allreduce, Test, and Waitall routines. Some routines exhibit long-tail effects.
Is it the GPUs? Isolating compute variability
We ran standalone FP16 GEMM benchmarks at three granularities — individual GPU, individual node, and system-wide — to separate compute variability from communication variability.
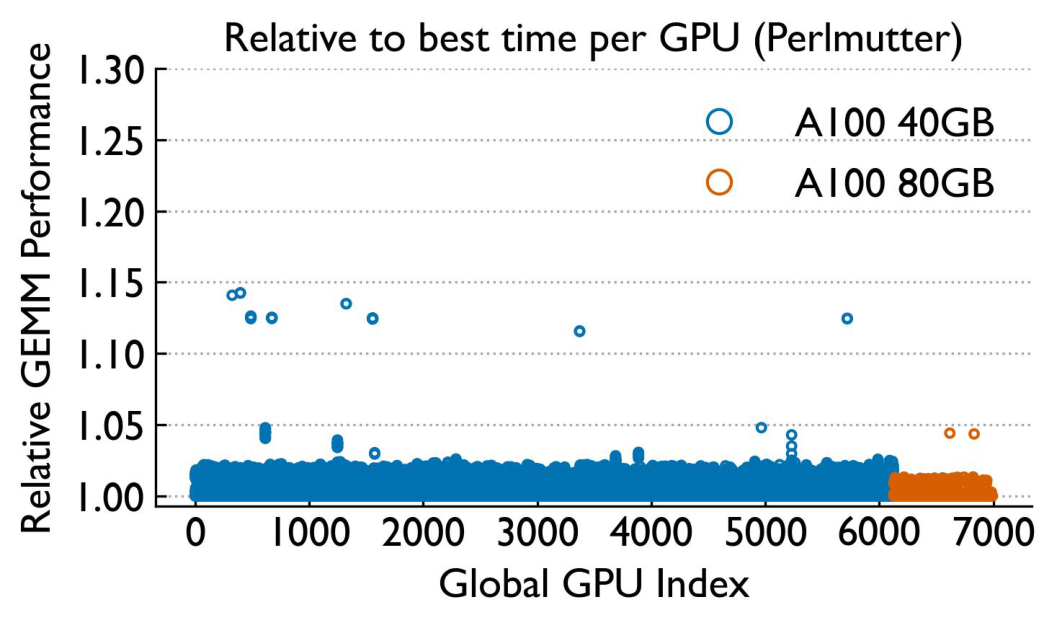
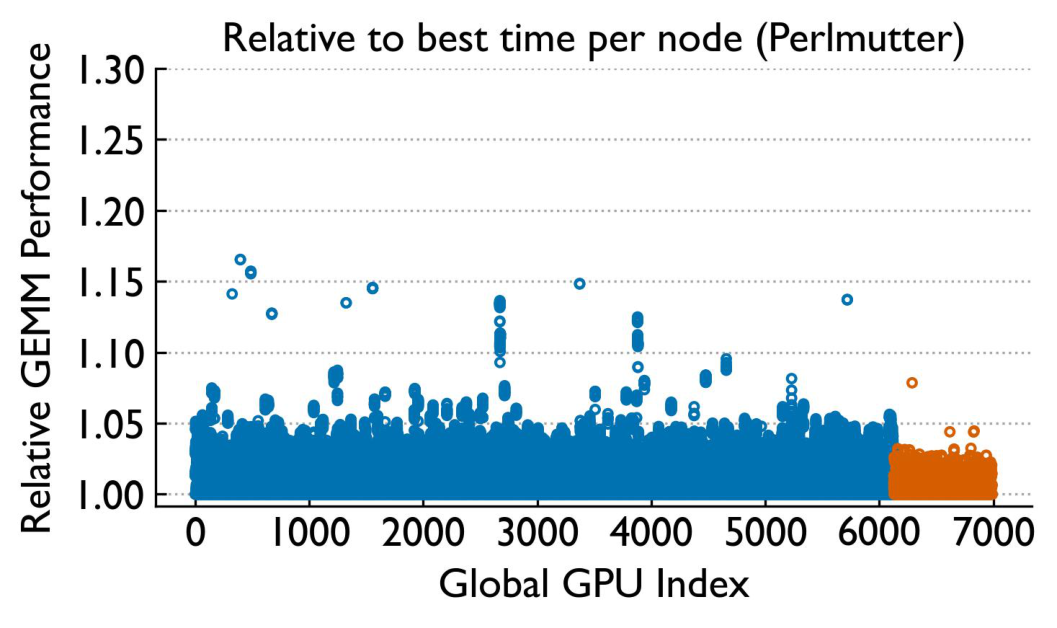
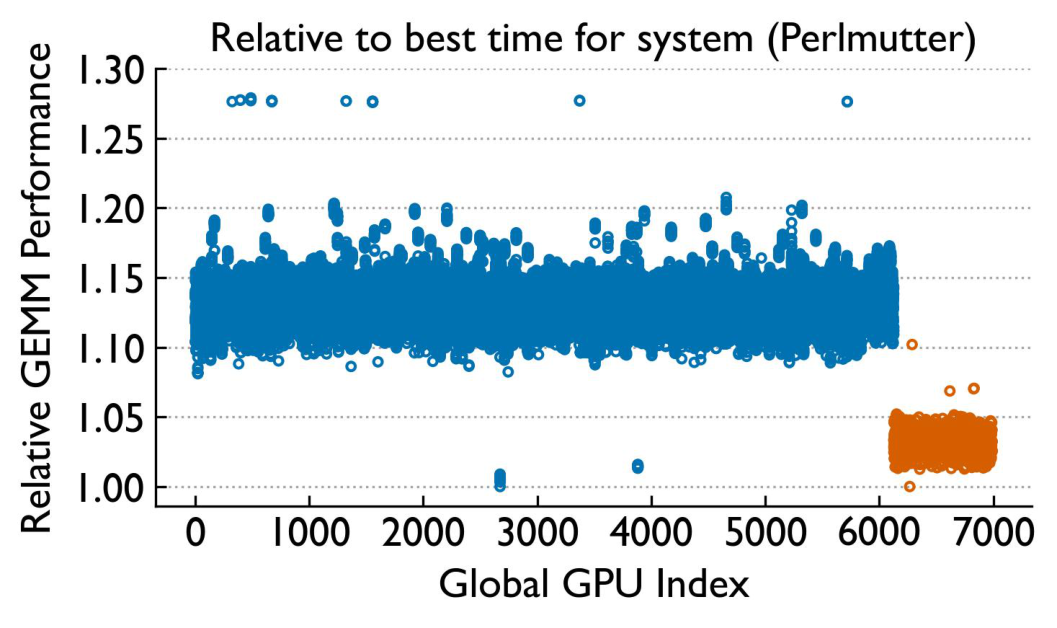
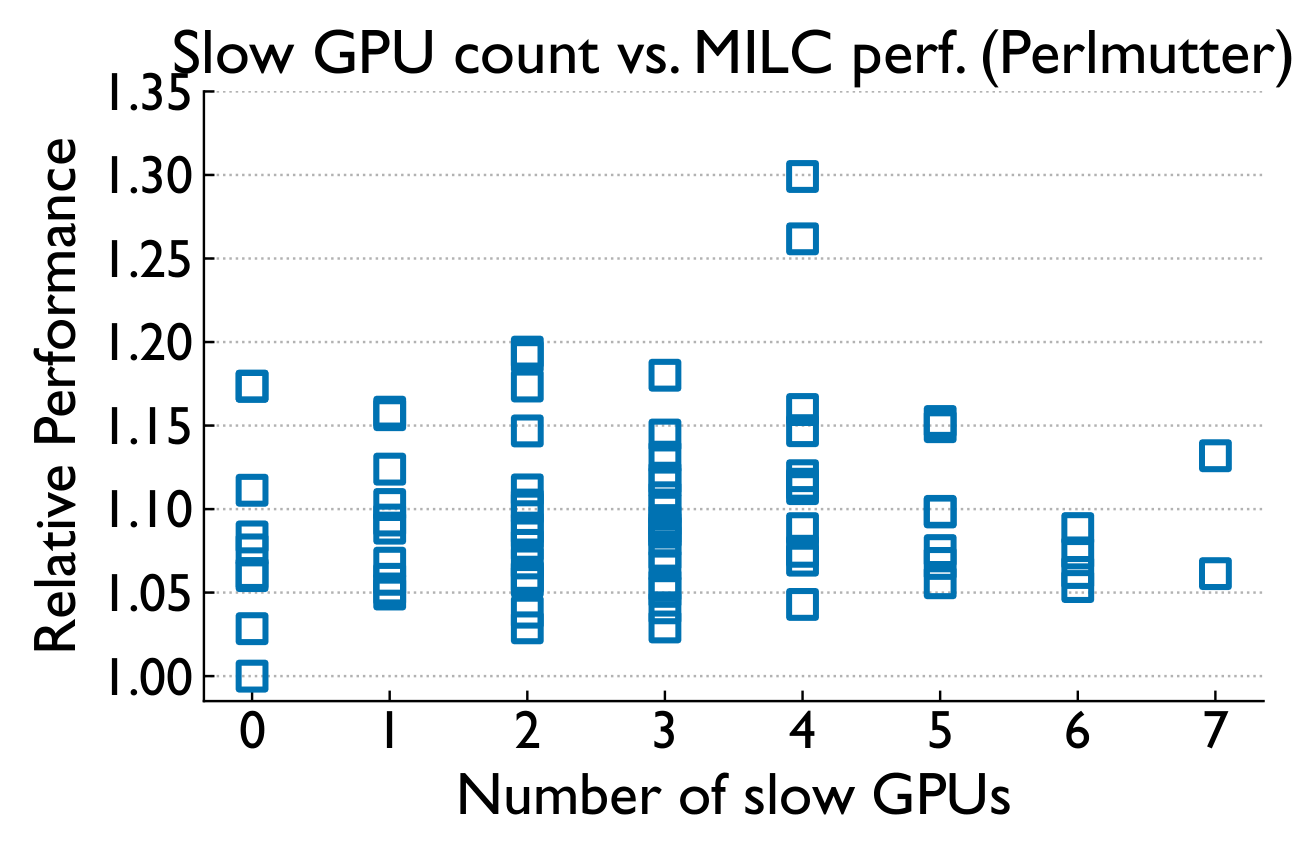
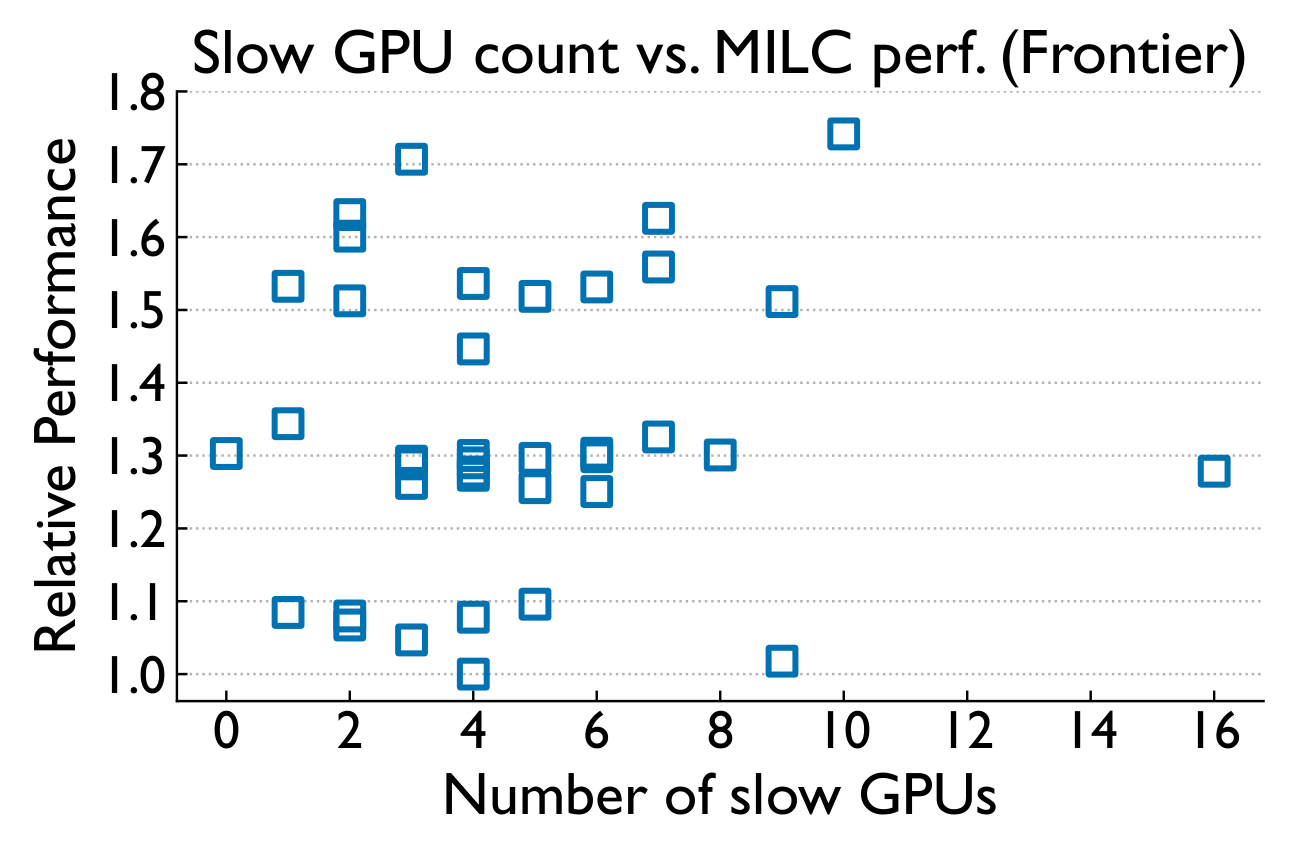
While single-GPU performance is relatively stable over time (especially on Perlmutter), there is notable variability across GPUs. GEMM variability is higher on Frontier but with fewer extreme outliers. Crucially, GPU-level variability does not correlate with application-level variability.
Topology and Concurrent Jobs
If communication drives variability, does where a job lands — and who it shares the network with — matter? We find the dragonfly group count is irrelevant, but a few noisy neighbors are not.
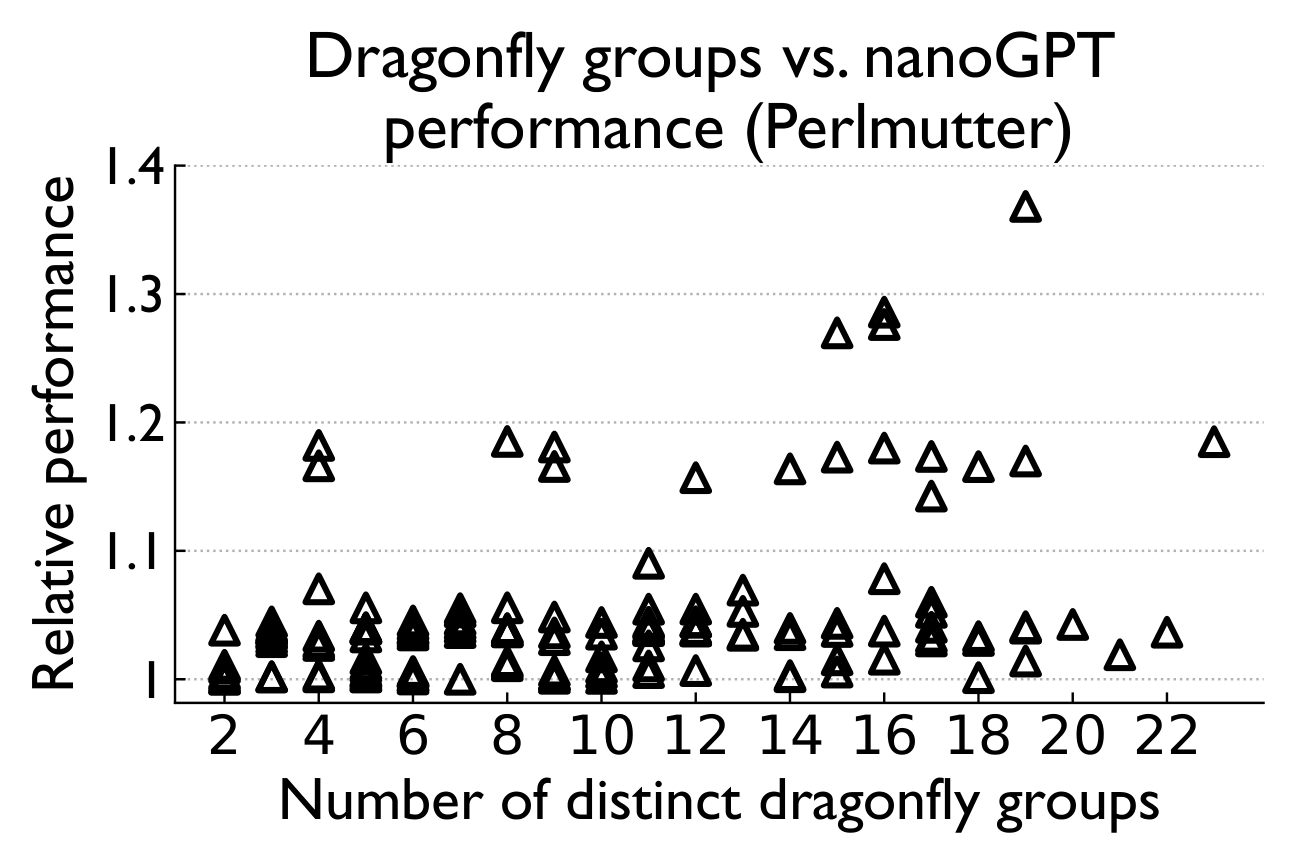
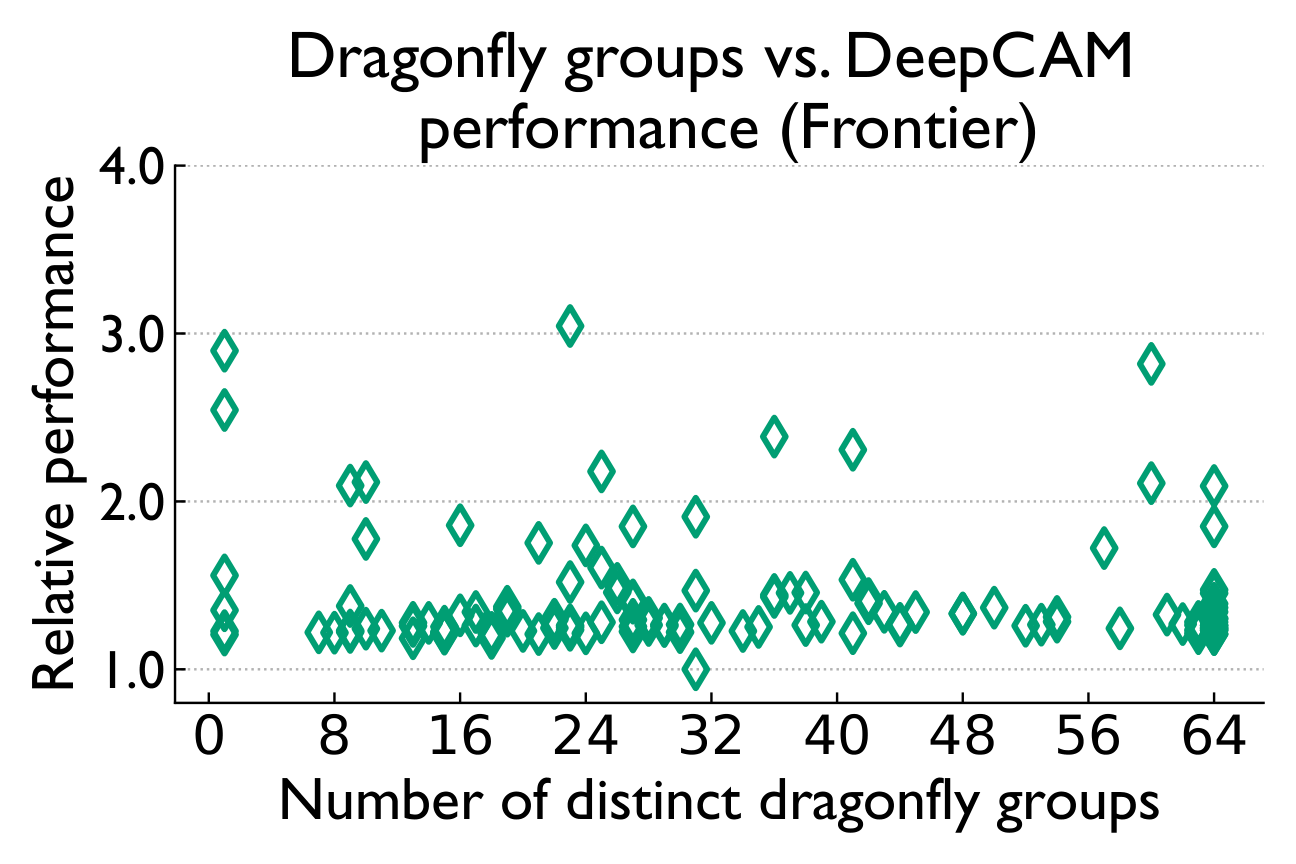
Dragonfly topology implementations on both Perlmutter and Frontier maintain high performance and scalability, even when computational tasks are allocated to a large number of dragonfly groups.
Not total load — specific noisy neighbors
Aggregate system-wide node usage barely correlates with runtime (Spearman 0.03 / 0.39). But when we isolate "Top Users" running communication-intensive jobs, a clear threshold effect emerges.
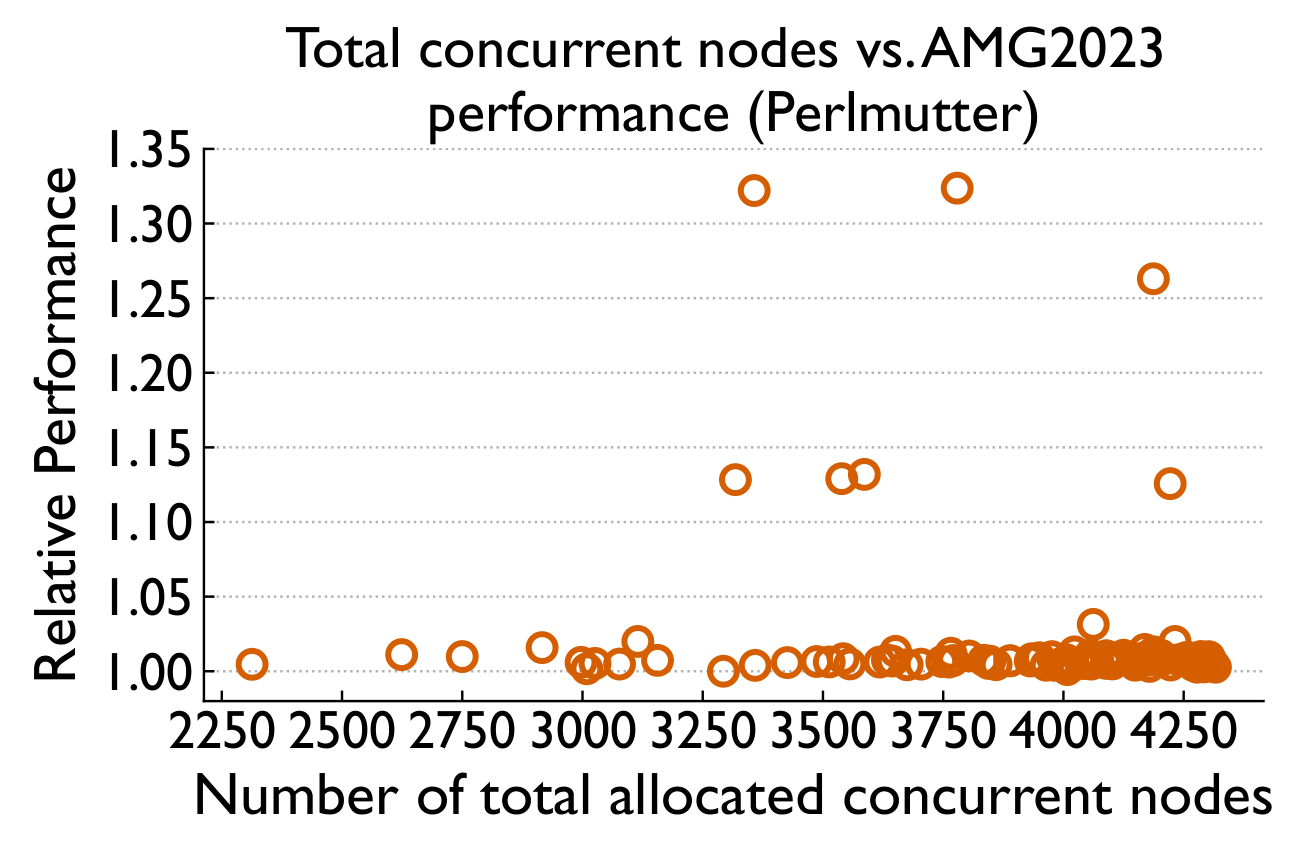
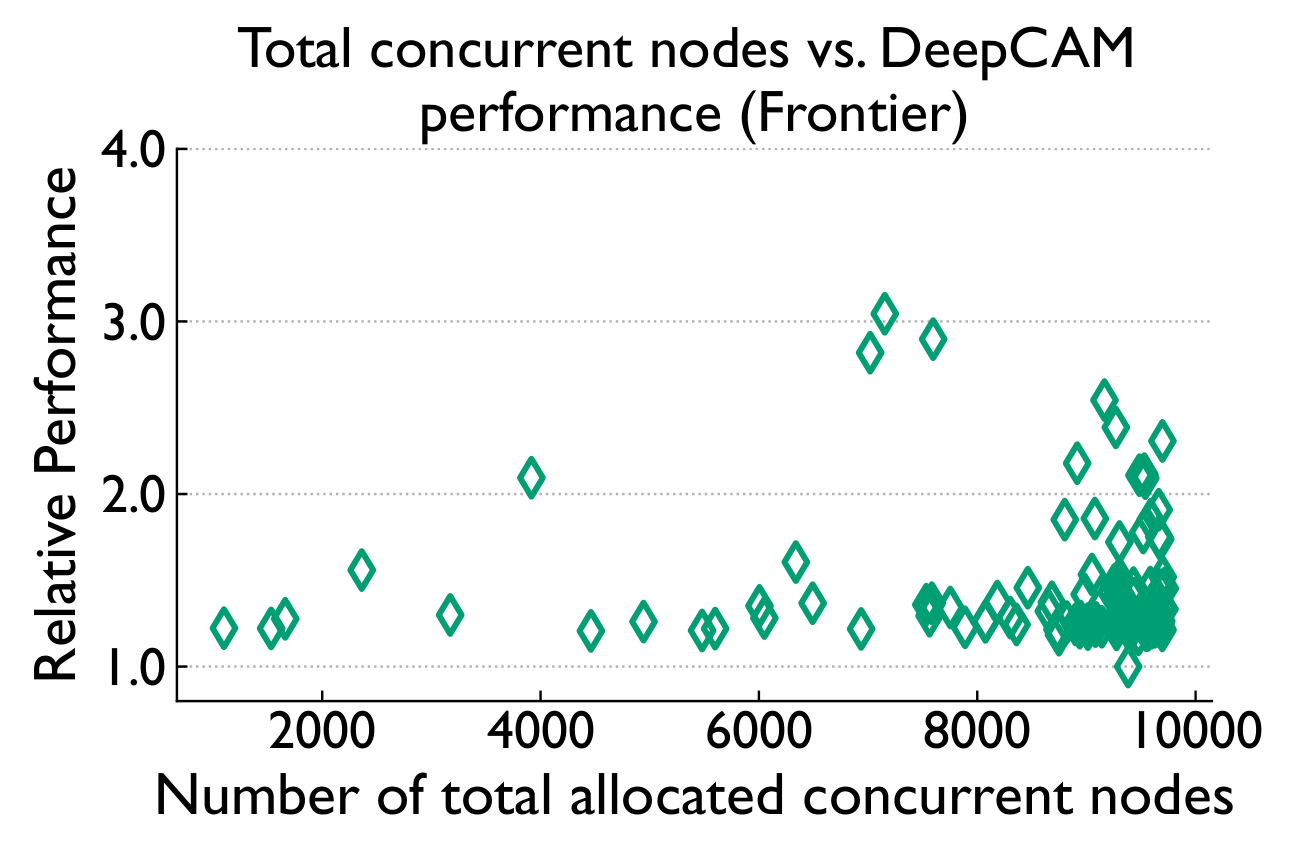
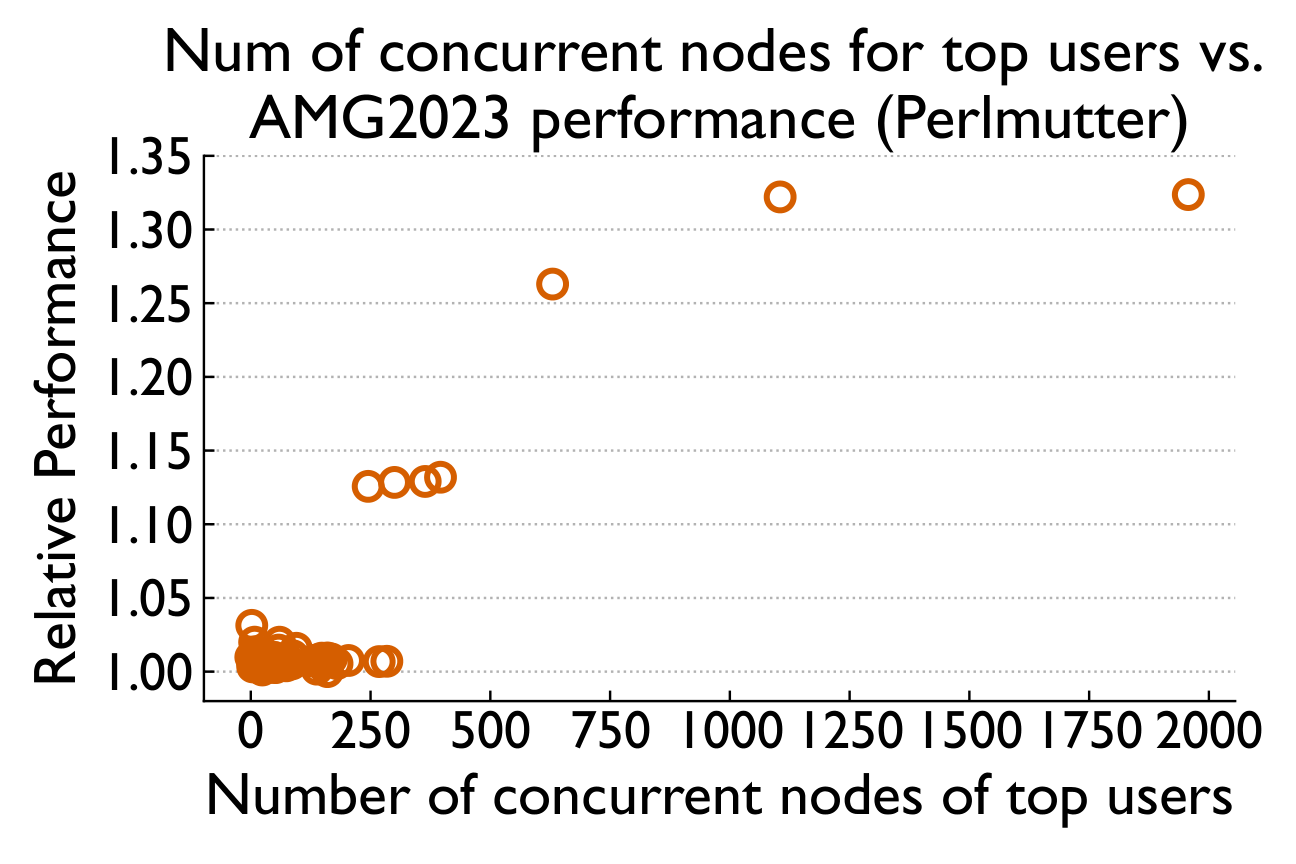
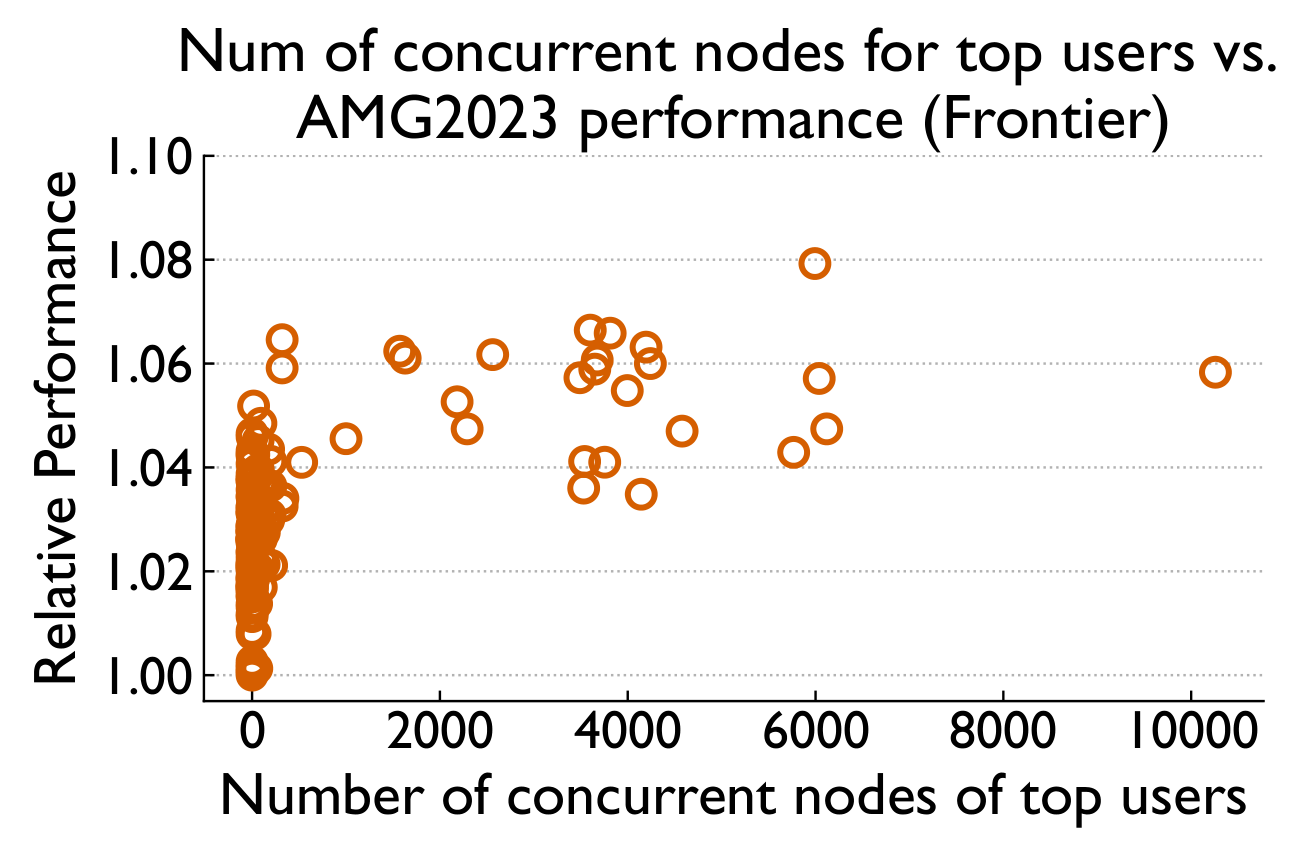
Overall system utilization alone does not explain the observed performance degradation; a few specific neighbors with high communication intensity can cause most of the performance variability.
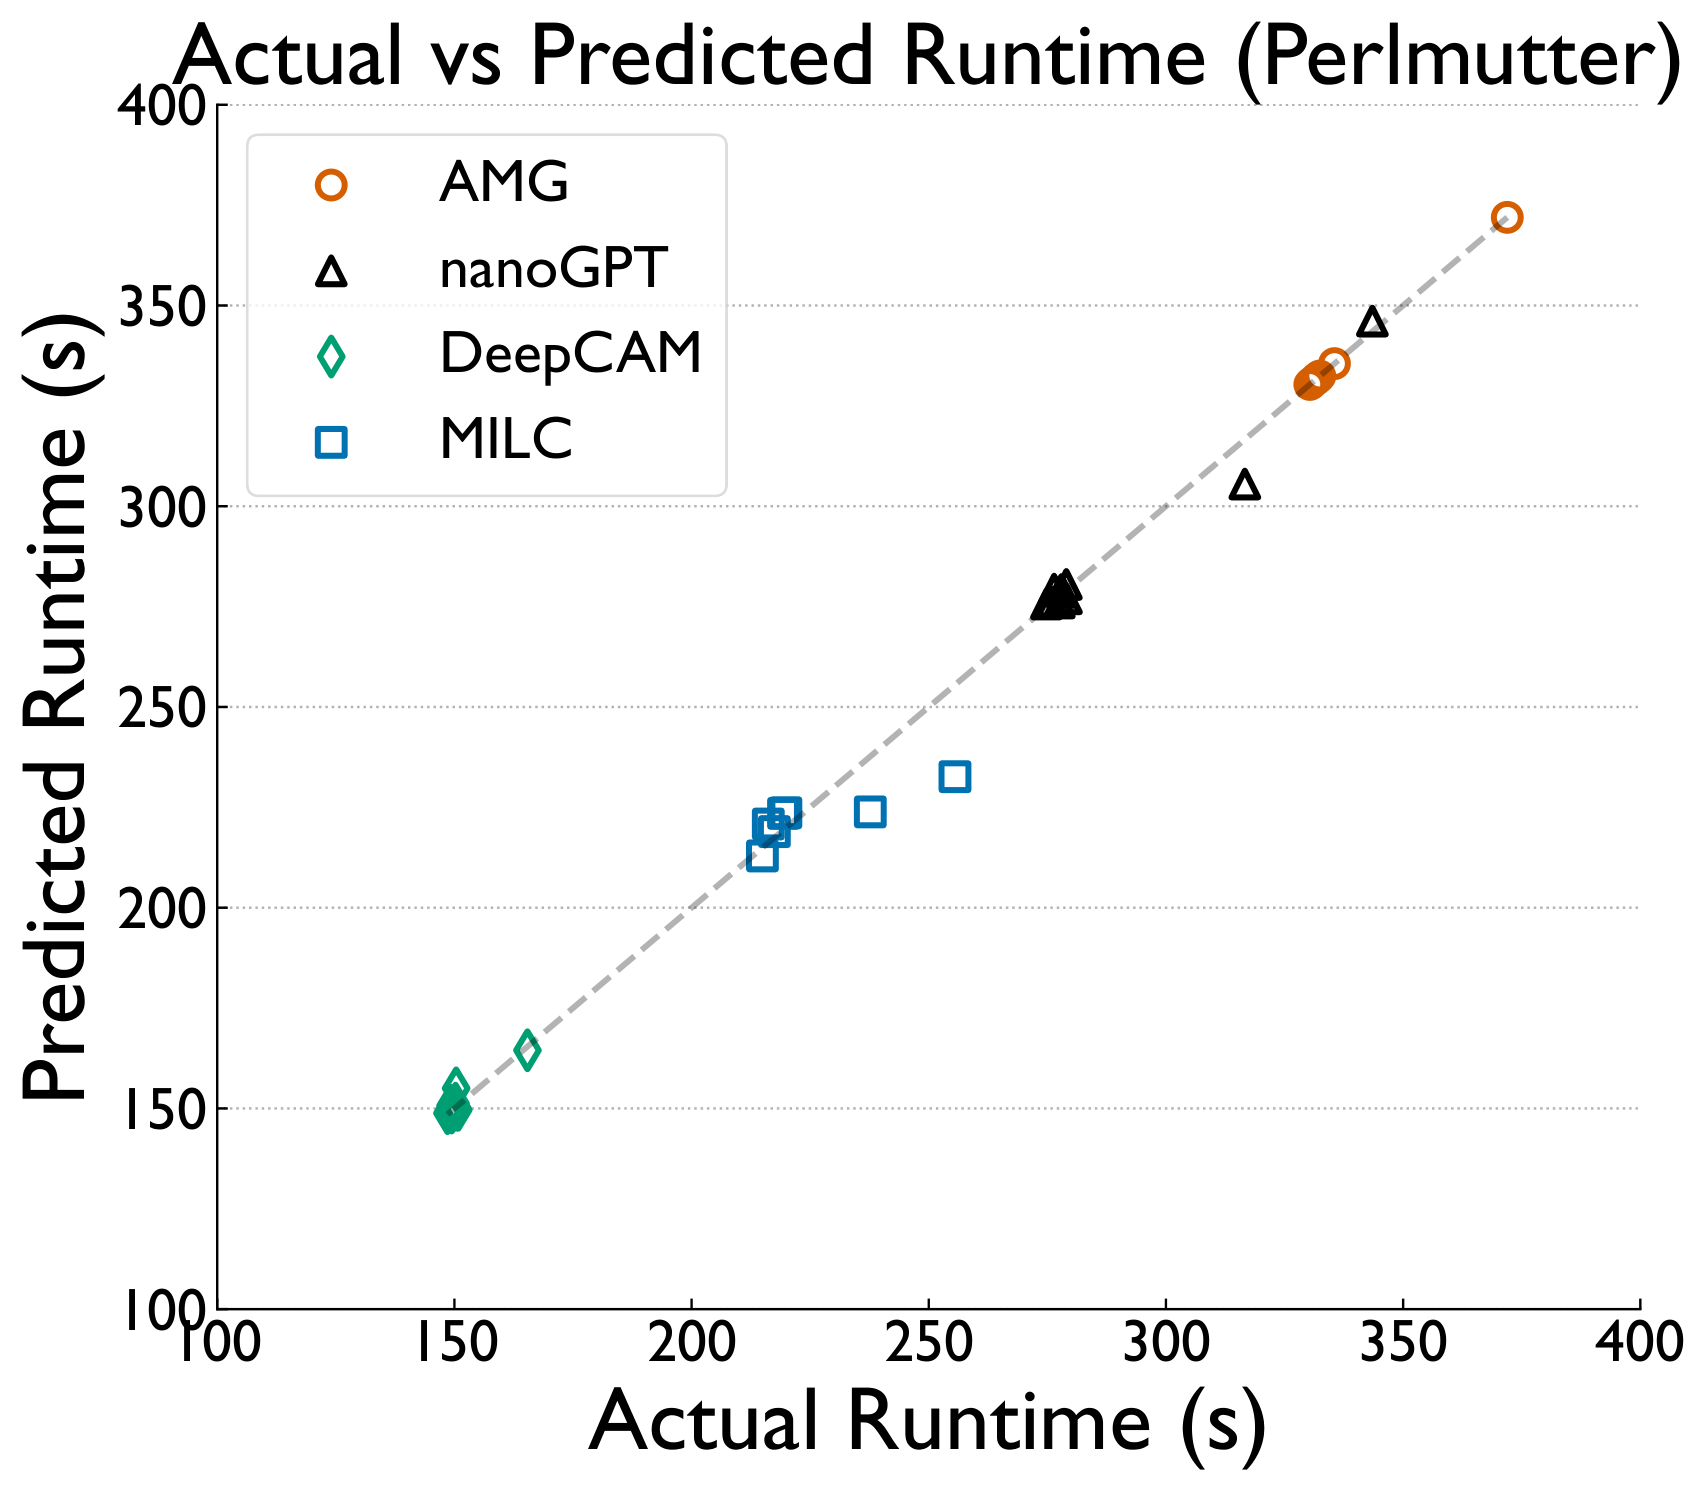
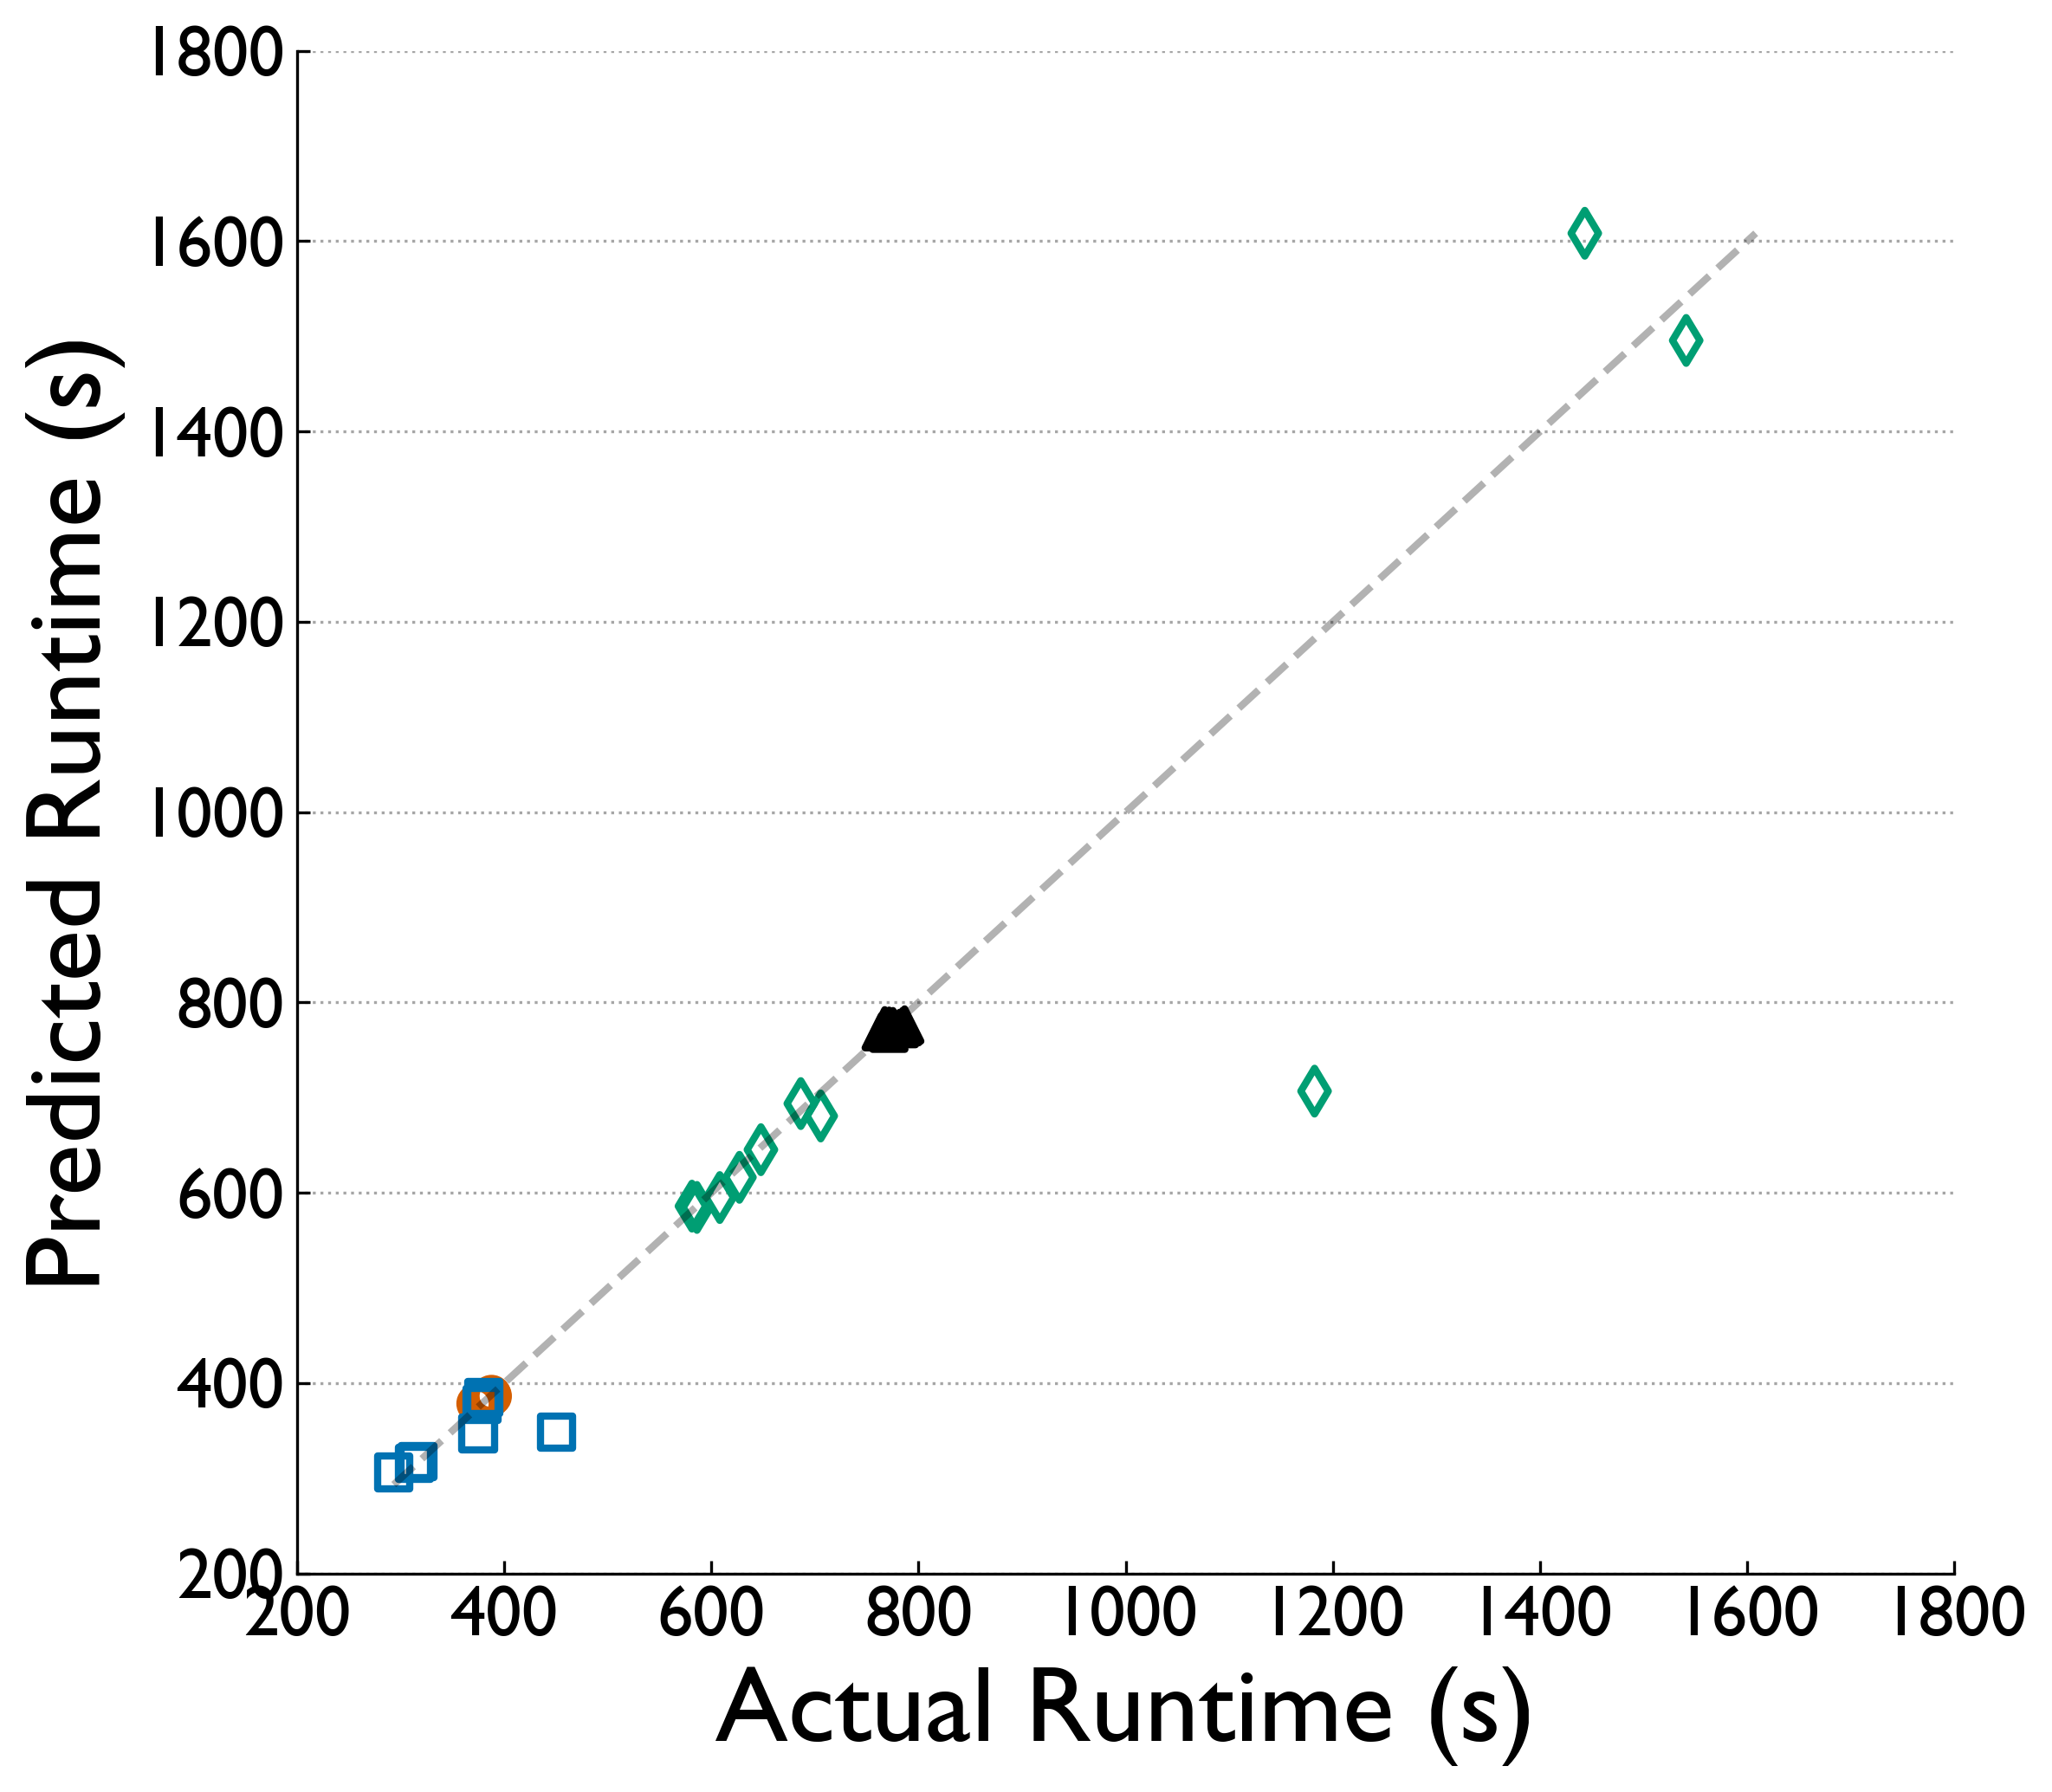
Forecasting Performance with XGBoost
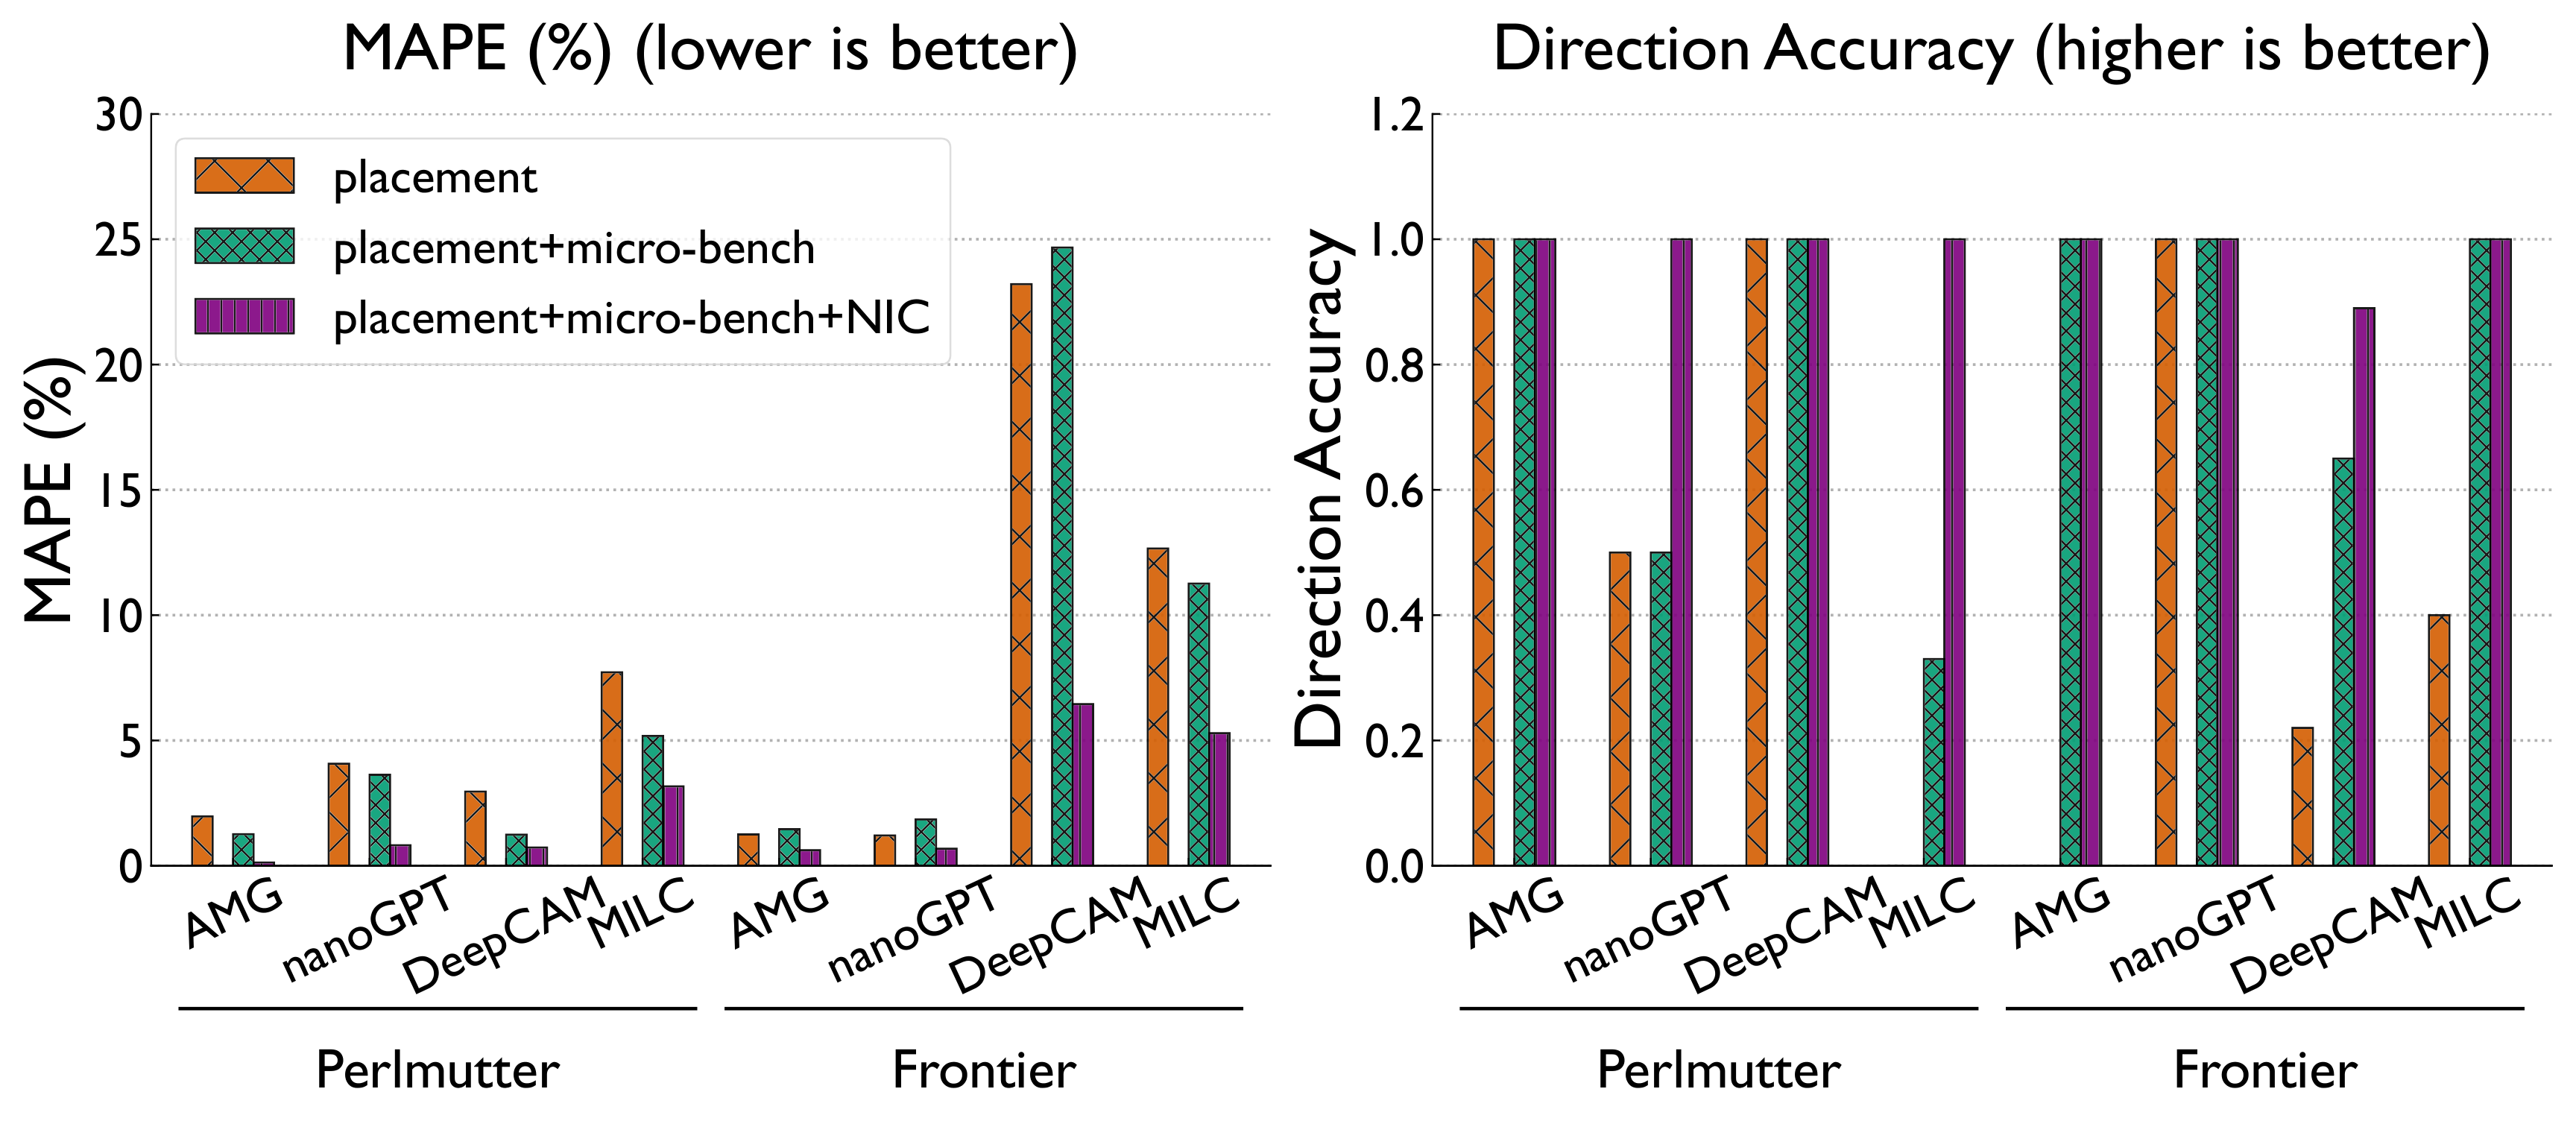
Static correlation of NIC counters tells only part of the story. We train XGBoost regression models on placement, GEMM, Allreduce, and Cassini NIC-counter features to predict runtime and identify what matters most.
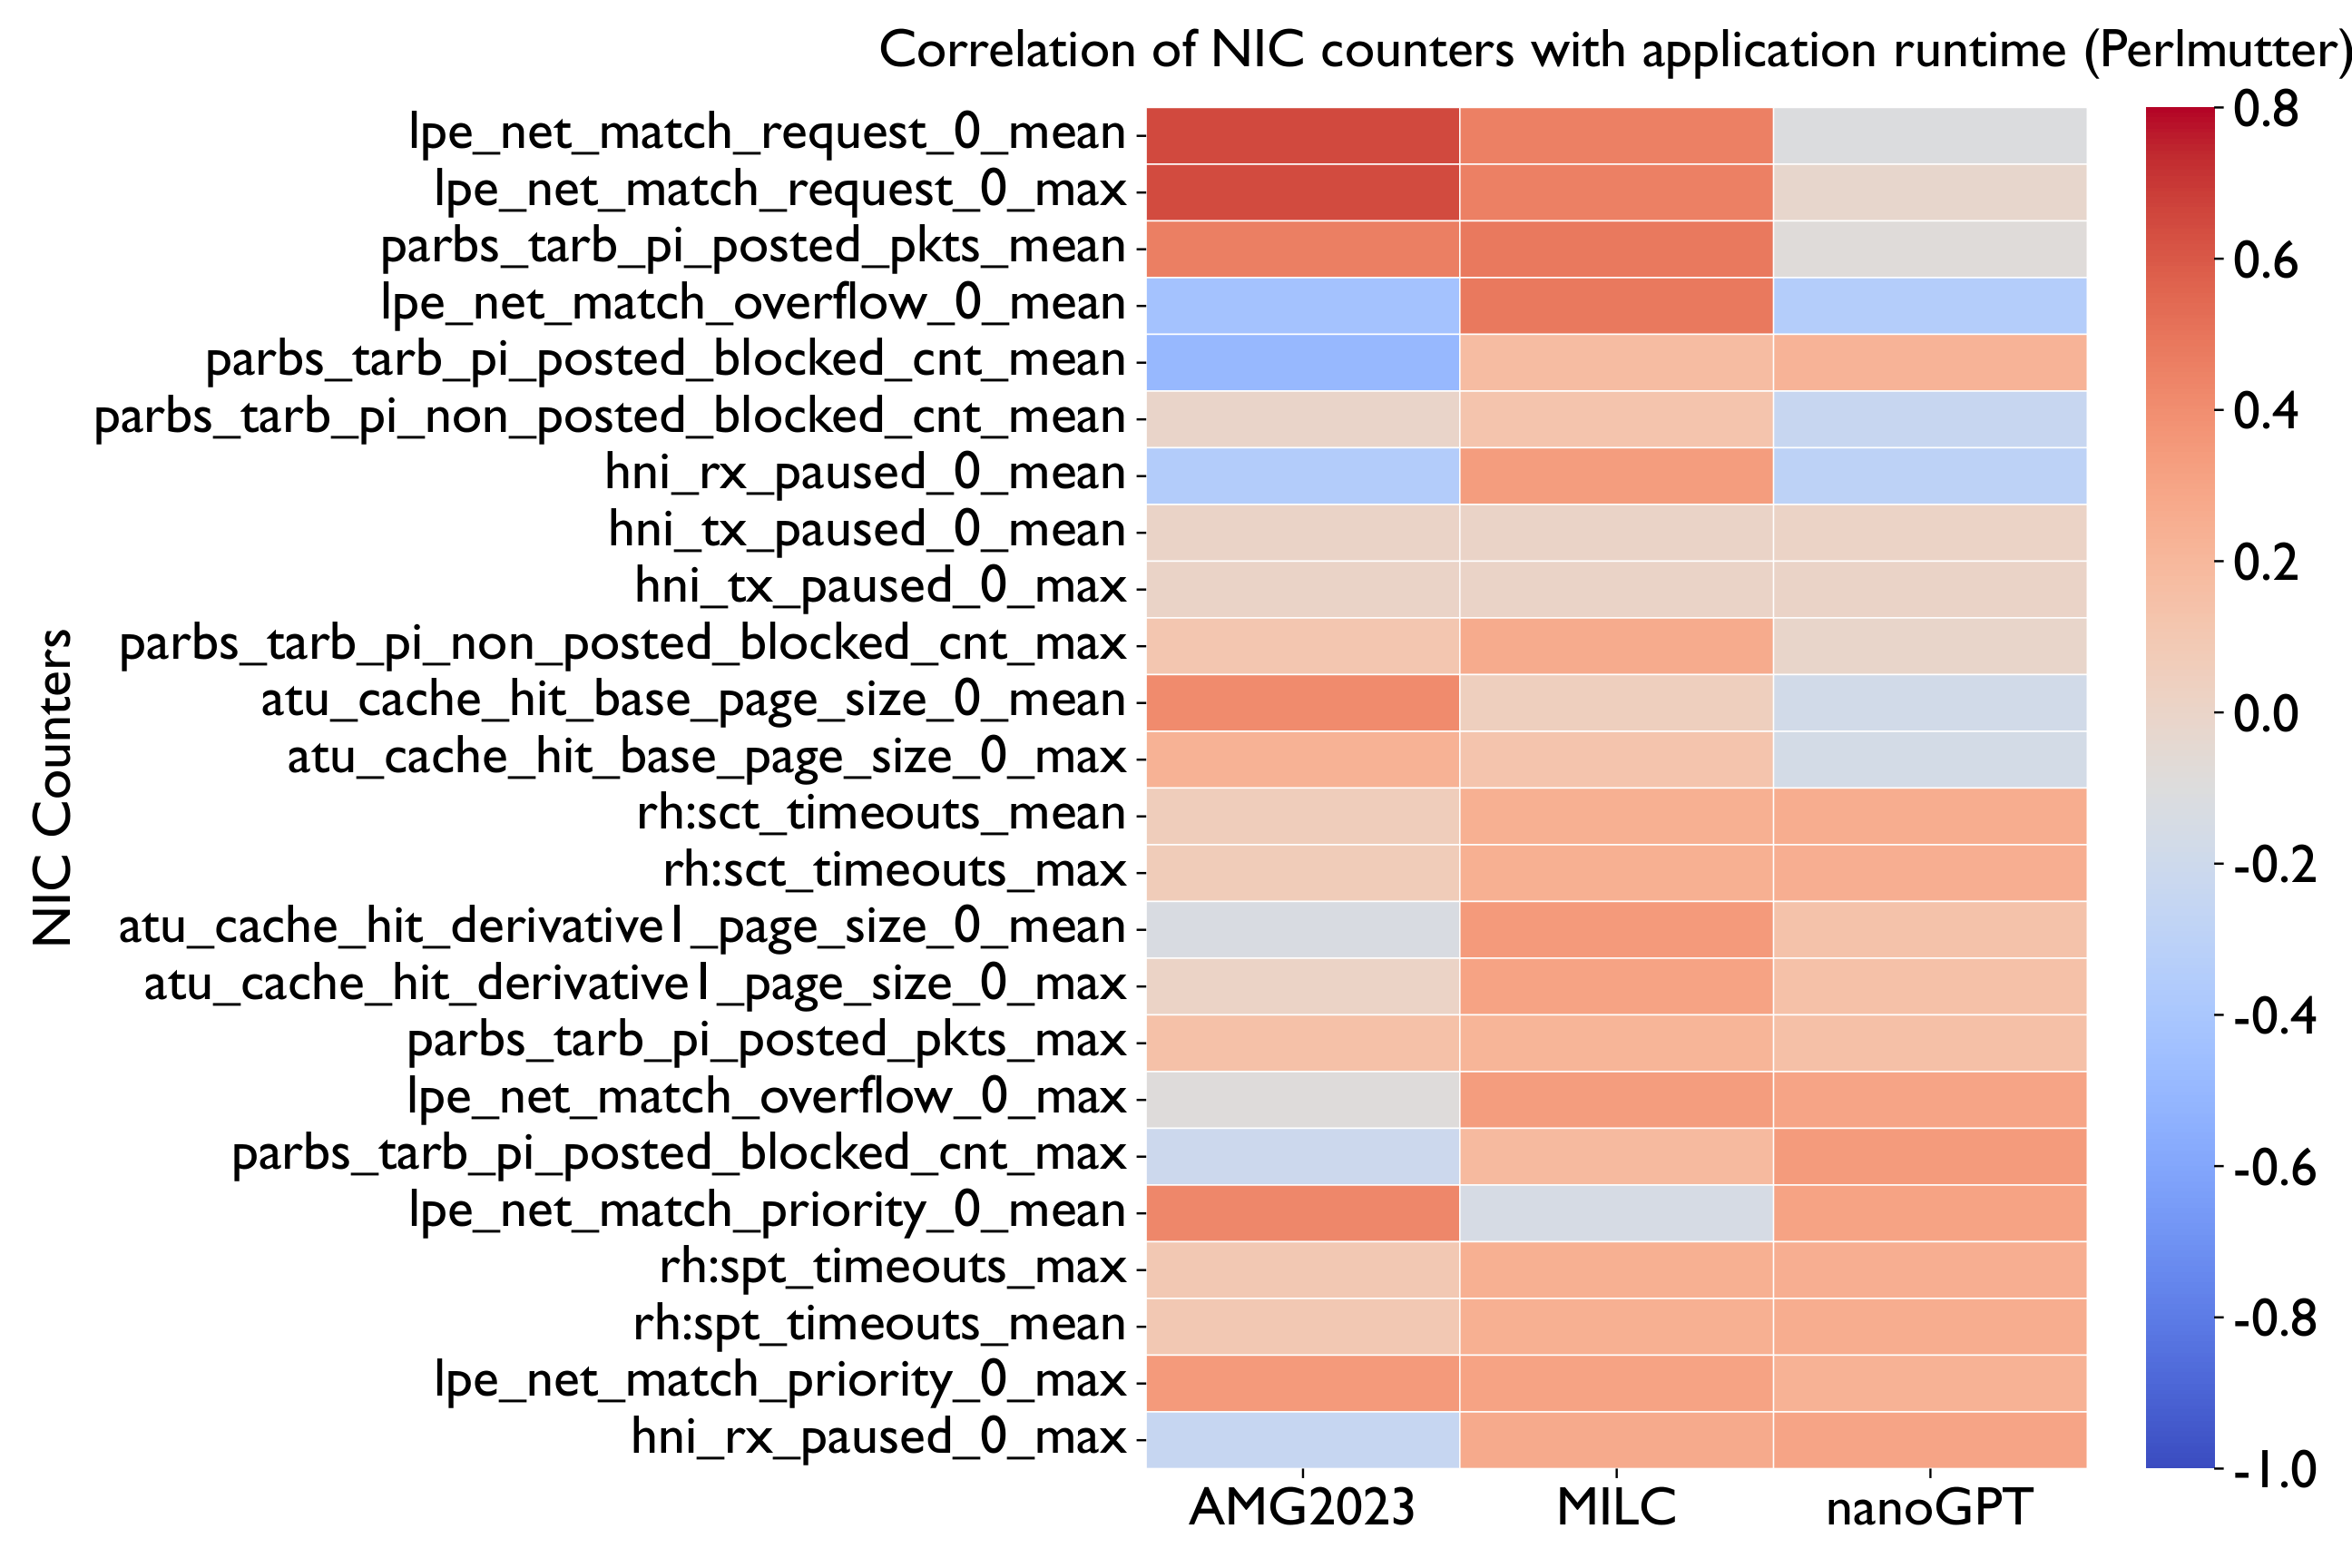
While NIC counters show some correlation with performance variability, they do not fully capture the complexity involved. More sophisticated models are needed to identify the relationships affecting performance.
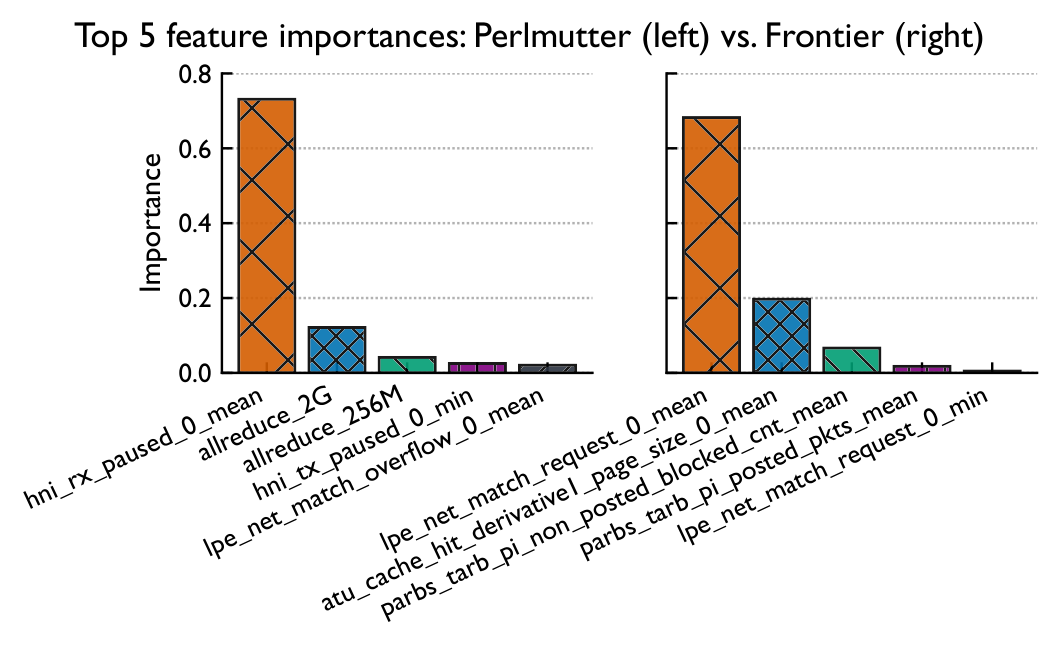
Traffic saturation causes Perlmutter's network processing to stall, while Frontier's blocking reads and cache hits expose bottlenecks in local data movement. Network-driven behavior dictates performance variability on both machines.
Insights & Mitigations
For System Administrators
- Several NIC counters are strongly tied to variability. Periodically apply predictive methods to proactively warn performance-sensitive users of degradation.
- Systems like Perlmutter already collect LDMS network-counter telemetry in real time — enough to train a universal degradation predictor.
- Monitor and cap concurrent communication-heavy jobs, or isolate them to a dedicated dragonfly group to keep the system healthy.
For Users
- Variability can be predicted with only a small set of your own profiling data.
- At job start, predict expected variability from the allocated nodes' state.
- If significant degradation is forecast, cancel early and resubmit — saving node hours.
Bottom line
Across both HPC and AI workloads on Perlmutter and Frontier, network performance — not GPU compute or job placement — is the dominant driver of run-to-run variability. Inherent GPU differences and dragonfly group count have little effect at scale; instead, network contention from a few communication-intensive neighbors, captured by NIC counters, governs performance. An ML model trained on these signals predicts runtime accurately, even for applications with only a few training samples.
BibTeX
@inproceedings{wei2026elusive,
  title     = {The Case of the Elusive Application Performance on
               Production GPU Supercomputers},
  author    = {Wei, Cunyang and Pradeep, Keshav and Bhatele, Abhinav},
  booktitle = {Proceedings of the IEEE International Parallel and
               Distributed Processing Symposium (IPDPS)},
  year      = {2026},
  note      = {University of Maryland, College Park}
}
Acknowledgment. Supported by NSF Grant No. 2047120. Used NERSC (DOE Office of Science, DE-AC02-05CH11231; awards DDR-ERCAP0034262, ALCC-ERCAP0034775) and the Oak Ridge Leadership Computing Facility (DOE, DE-AC05-00OR22725).